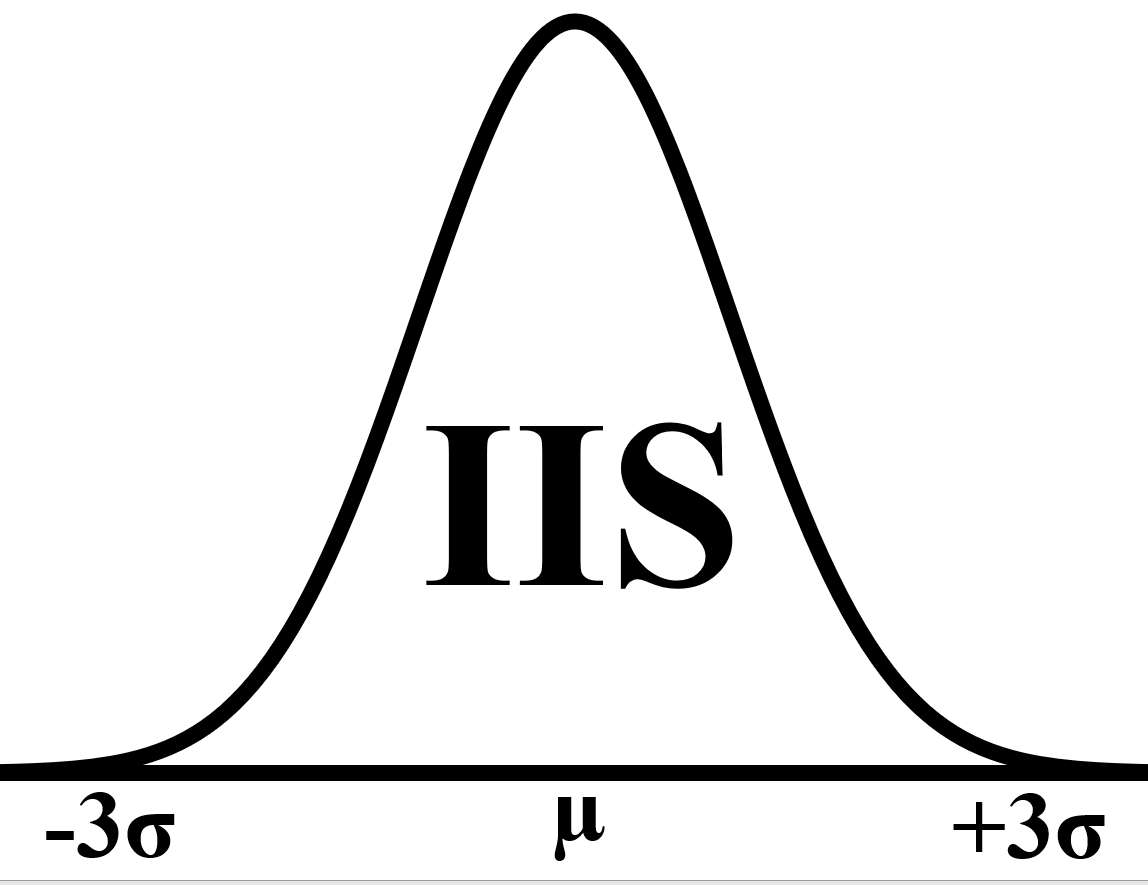
Capability studies are the single most useful tool for characterizing and analyzing process variablity.
Unfortunately, without automation tools they are very expensive and time consuming to perform.
Academically, a 32 piece sample approximates normal distribution.
On an 8 cavity die with 100 drawing features to inspect we are looking at 25,608 points to report. Without automation this is a daunting task.
The probability of introducing variability into the data because of data entry errors is large and the amount of time it takes to inspect the parts and generate the study far to great to be cost effective.
Typically we see customers reducing the sample sizes to overcome this problem. This will work if the data is tight and close to nominal however, the normal distribution curve is severely skewed at 10 pieces.
If the population is not normally distributed or not in control you are throwing the dice when making tooling change decisions. If you are purchasing Process Capability studies and your metrology vendor cannot demonstrate some form of automated collection and analysis find someone who can.
This is without doubt a “pay-me-now–pay-me-later proposition.”
We understand the importance of not contaminating the inspection data and strive to minimize the possibility at every phase of the inspection process.
Every part inspected has it’s setup points re-verified at the end of the run. If the setup does not verify, we know that some outside influence has been introduced (.e.g. the part slipped in the fixturing, dust on the part, a probe came loose etc.)
The setup re-verification is checked on every part before it is pulled from the inspection equipment. If it doesn’t verify the part is re-inspected.
We typically run a five piece repeatability study in addition to Capability Study.
For those applications which require it (.e.g automotive), we can provide a full blown Gage R&R. Every piece inspected has it’s data captured, cataloged and stored in our database. Once all of the parts are inspected we programatically create the Capability Study in Microsoft Excel . The Excel workbook includes function to check each features data set for statistical outliers without respect to the specification tolerances.
Thermal ramping and mold closure problems clearly show up using the outlier algorythm.
Each study goes through two levels of review. First by our technicians and then a qualified metrologist. We comment the data as needed to describe the problems we see. Once we’ve submitted the study an IIS sngineer is available to help you with the interpretation. If need, we will send an engineer to your site to help with the interpretation process.
Our automation system allows us to build and analyze Capability Studies 100 times faster than can be done with conventional hand typed methods.
Further data integrity is not compromised since the creation of the studies is purely programmatic with no human intervention.
Every inspection is cataloged and backed up on a file server.
Competitors may use analysis tools shipped with their inspection equipment. This is also less than ideal because the reporting tools are static.
Static reports fall short in two major areas (1) “what if” analysis (2) not easily distributed
